Dynamic Real- Time Reporting
Analyze your survey results and gain insights by comparing data over different time periods or respondent groups.
Bring your Data to Life!
Our reporting enables you to analyze and evaluate surveys in real-time and share reports via dynamic links. Furthermore, survey data can be exported in several formats: CSV, PDF, PPTX, XLS.
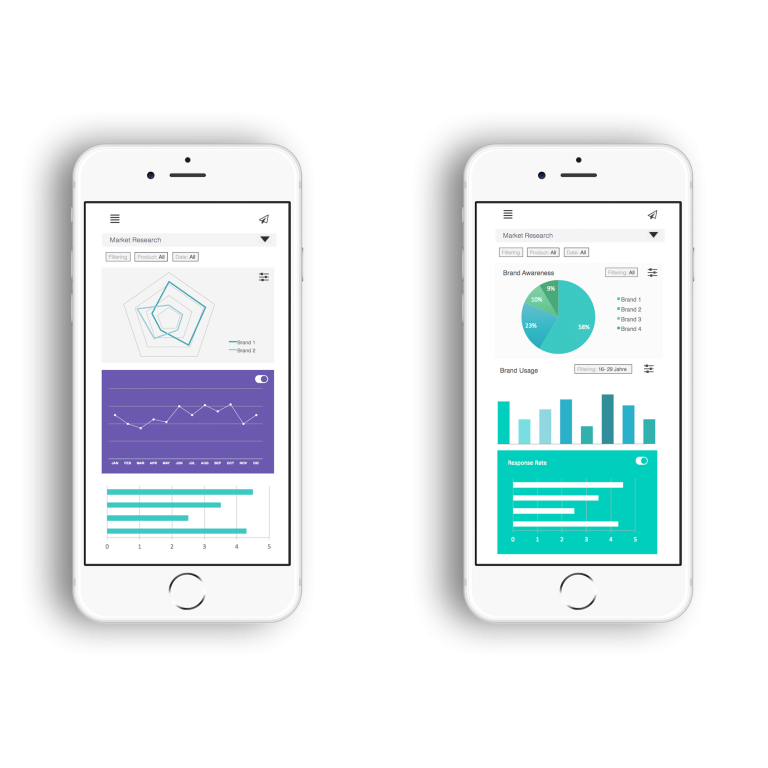
Reporting & Data Export
With our online reporting you have comprehensive and individually adaptable reporting features. Our dashboard allows you to display various charts: e.g. pie, line or bar.
z.B. Balken-, Donut-, Linien- oder Stabdiagramme.
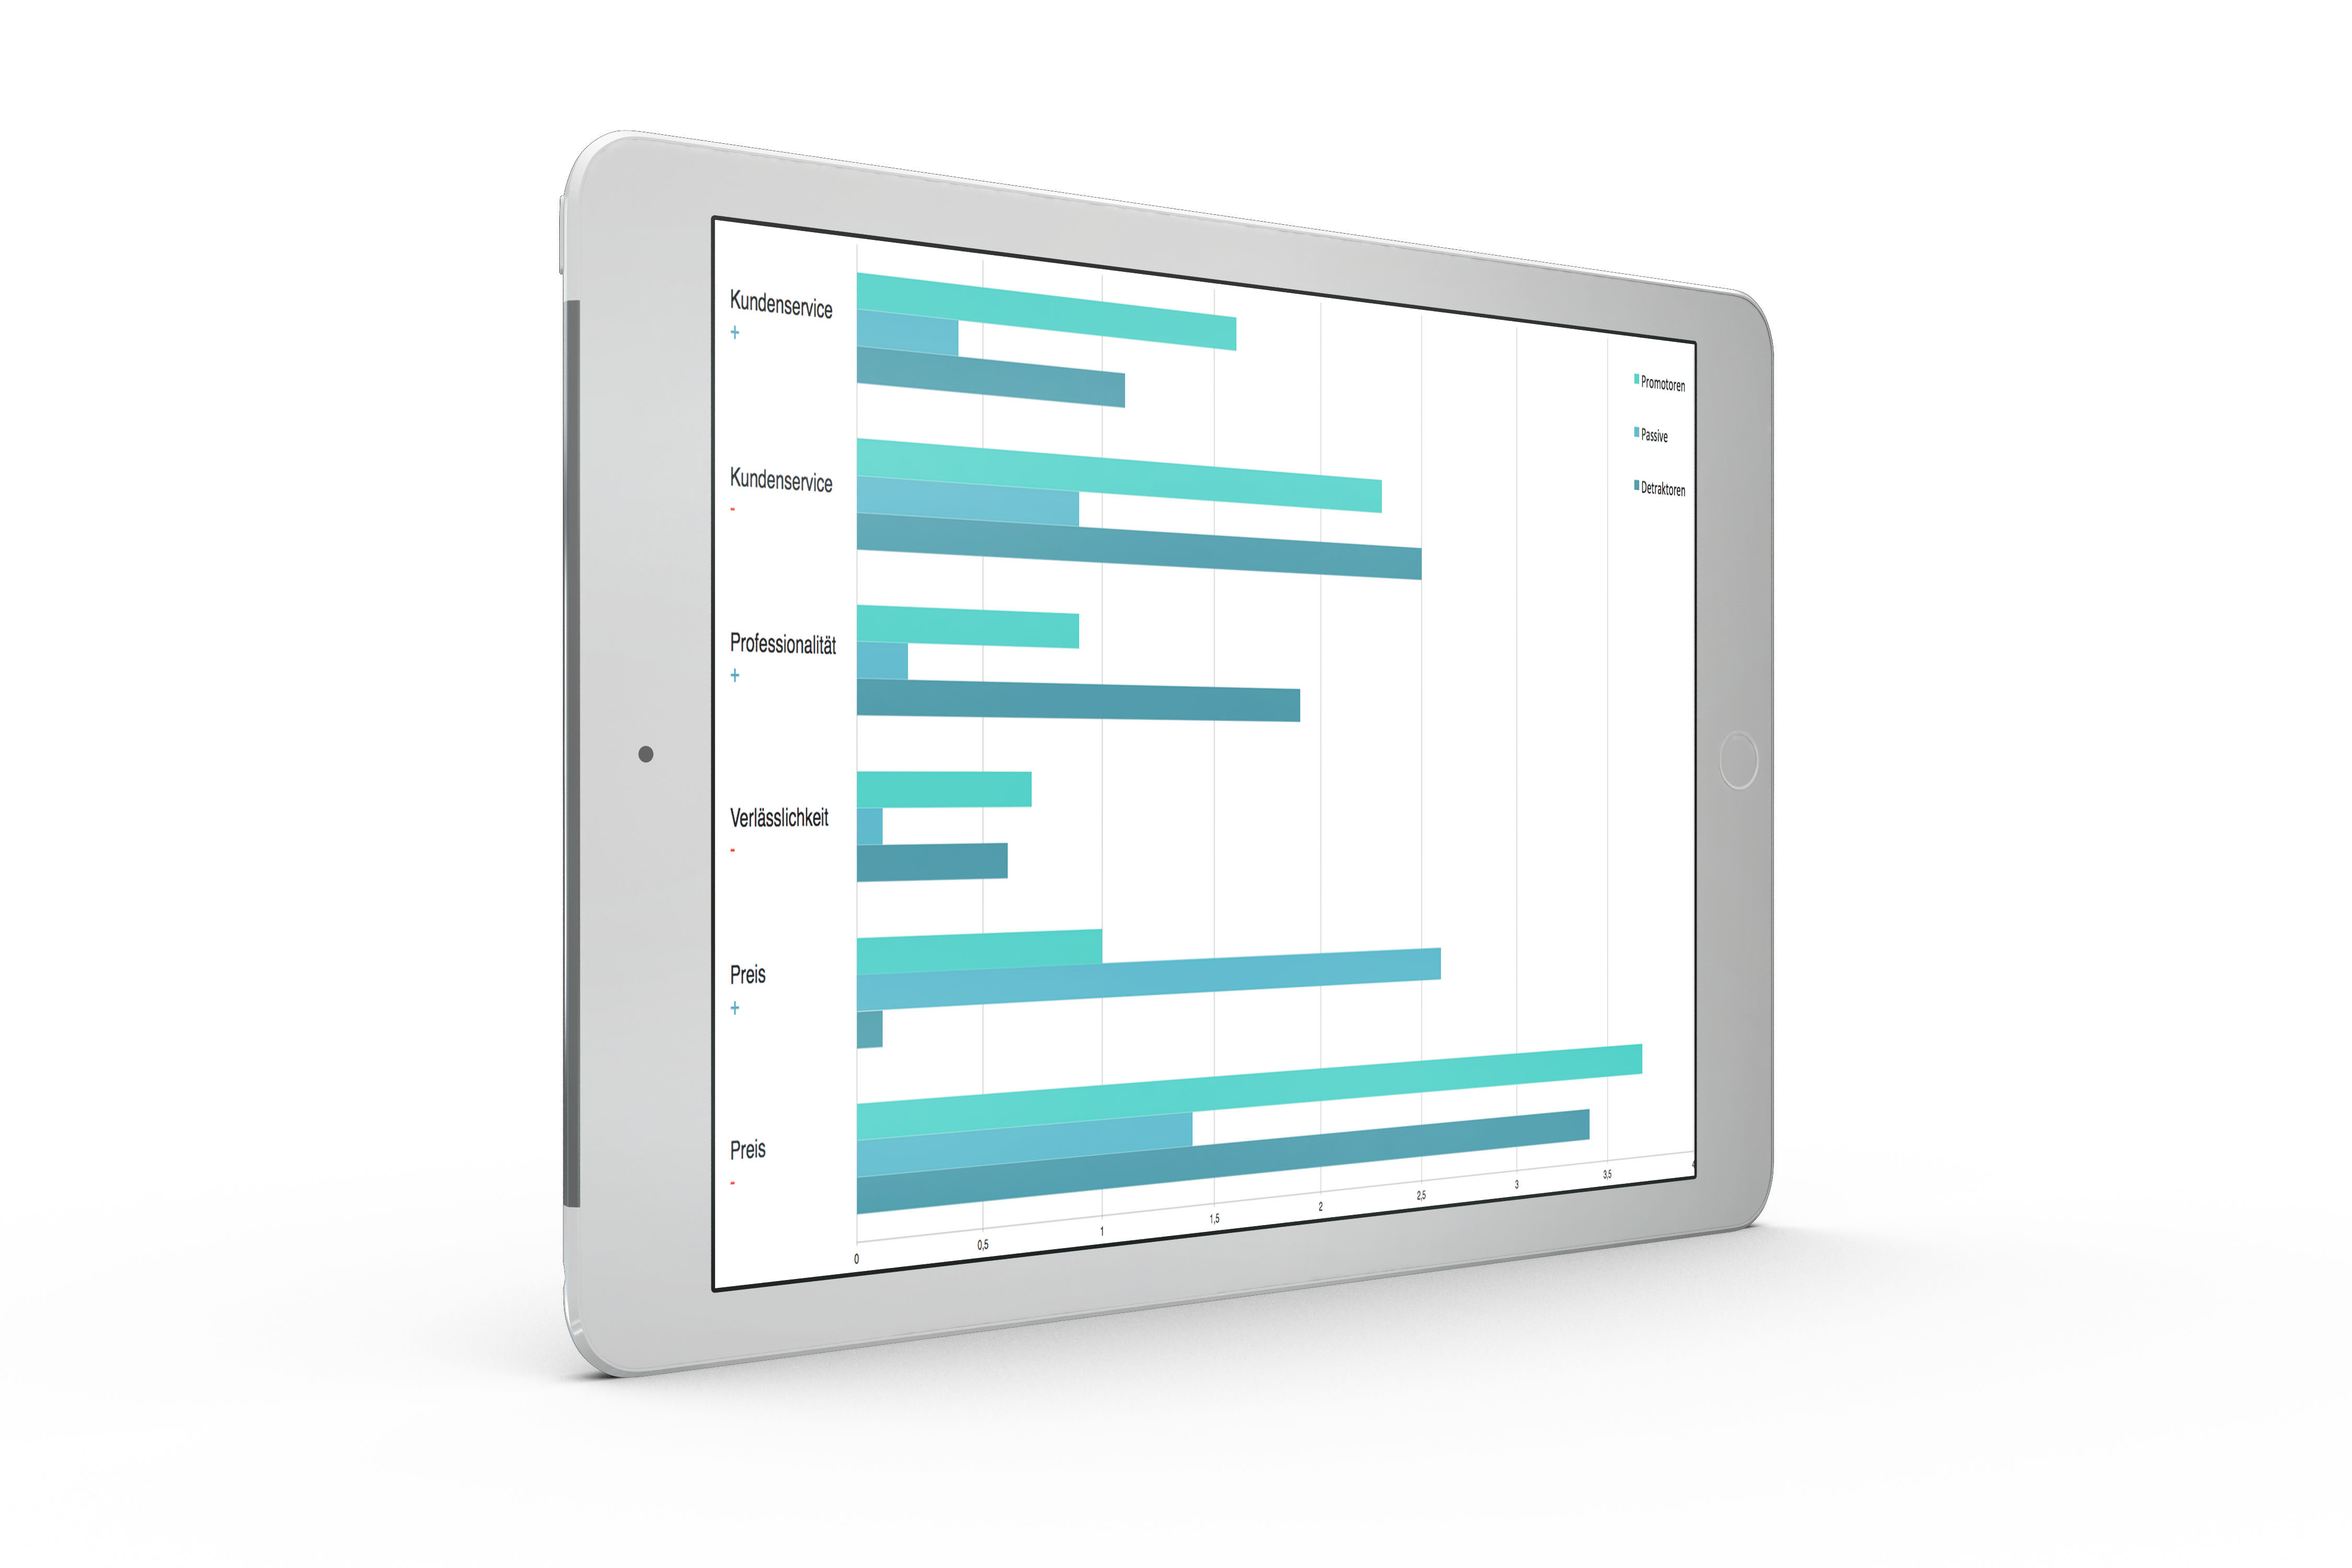
Gain deeper Insights out of your Data.
In open end questions, Promoters and Passives very often leave a similar level of positive remarks concerning a particular subject. However, there often are huge differences regarding the negative remarks of the two groups.
Use our automated text analysis tool to find out where the significant differences lie and get an overview of which touchpoints you should optimize.
Filter Results
Analyze survey data, create individual reports and easily share them via dynamic links.
Export of results
Simply export survey data to a file format of your choice: XLS, CSV, PDF or SPSS.
Allocation of user rights
Our reporting enables you to assign read, write, delete and delegation rights.
Useful advice
- Use filter limits to ensure anonymity of respondents.
- Save individual reports to access them again anytime later.
- Incomplete surveys can be blanked, but often still contain interesting findings (e.g. free text fields).